")

Munich 2100
Tracing Climate Change in Munich
21.09.2018
Supervisor: Dr. Ursula Münster
The aim of this project was to show different aspects of climate change in Munich. First, a short introduction of expected climatic changes globally as well as in Munich itself will be given. Consecutively, steps counteracting these expected changes will be shown. The project is implemented in the form of a story map. A story map allows for an interactive multi-media look at the topic. This project includes images, graphs, videos, and geospatial data, making the story map format the perfect option to present this wide variety of data.
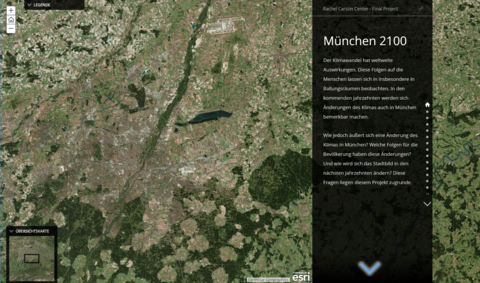
Climate change influences us all in a certain way. Often, the conversation on climate change is held on a global scale. However, climatic changes have very local consequences, as well. Finding and presenting these local changes for Munich was one of my main goals. The target audience is, therefore, anyone who lives in Munich, and who has ever wondered how climate change is influencing Munich and its inhabitants or will influence them in the future.
As geographers, we are trained to optimally try and see an issue from many different perspectives. Discussions with peers and fellows from other disciplinary backgrounds at the Rachel Carson Center often introduced an aspect one might not have thought of before. This goes to show the importance of interdisciplinary work. Consequences of climatic change cannot be tackled by just one discipline, we all have to work together and learn from other disciplines. Therefore, the interdisciplinary format of the Environmental Studies Certificate Program enabled me to have this valuable process of learning.
The aspects of climate change in a city vary widely. One challenge I faced was selecting which aspects to include, and representing these aspects in a spatial format. While I tried to be diverse in the selection of aspects I wanted to present, there are many I had to leave out. Another challenge was the choice of terms, especially regarding the concept of climate projection. Modeling climate data is common in my field, whereas the broader public may not be familiar with it and the terms related to it. Therefore, presenting it in a short and understandable yet accurate way proved to be another difficulty.
For the complete list of references used in this project, please see the last page of my story map. Any reference to graphics and videos can be found there, as well.